
Veröffentlicht am 23rd Mar 2018
Geändert am 28th Apr 2020
Geschichte des Goldunzenpreises im Vergleich zu einem Laib Brot
 Vor über sieben Jahren, im September 2010, schrieb ich diesen Artikel über die Geschichte des Goldunzenpreises im Vergleich zu einem Laib Brot. Aber wie konnte ich mich so irren? Ich habe einen landwirtschaftlichen Hintergrund und als Investor verdiene ich so mein Einkommen. Jetzt, im März 2018, habe ich diesen Artikel mit meinen neuen Gedanken und Erfahrungen aktualisiert.
Aus Gründen der historischen Authentizität werde ich die Details meines Originalartikels nicht ändern. Sie finden sie ganz unten in diesem Artikel.
Warum also ist mein Vergleich zwischen einem Laib Brot und dem Goldpreis so weit hergeholt? Jahrhundertelang war Brot das Grundnahrungsmittel und ein wichtiger Rohstoff im Hinblick auf die Lebenshaltungskosten. Aber ein Laib Brot wog jahrhundertelang über ein Kilo, verglichen mit 400 Gramm heute, und einige Geschäfte verkaufen heute 350-Gramm-Laibe. Offensichtlich ist mein Größenvergleich völlig daneben, da große Supermärkte Preis, Qualität und Größe unserer Brote reduzieren!
INFLATION
20 Jahre lang lag die Inflation im Durchschnitt bei 3,22 % pro Jahr, das ist enorm. 1776 hatten die USA eine Inflationsrate von 29,78 % und heute liegt sie bei 2,1 %. Aber beachten Sie, wenn die Lebenshaltungskostenindikatoren eine steigende Inflation anzeigen, bricht der Aktienmarkt zusammen. Regierungen können die Inflation durch geringes Lohnwachstum kontrollieren, und das hat in den letzten sieben Jahren Wirkung gezeigt.
GETREIDE NIEDRIGERE KOSTEN
Mir ist erst jetzt klar geworden, wie die Preise für unser Getreide, Weizen, Gerste, Hafer und Mais im letzten Jahrzehnt eingebrochen sind. Familienbetriebe werden heute von Multikonzernen übernommen und es werden neue kosteneffiziente Anbaumethoden eingesetzt, sodass Getreide billiger ist und zur Deckung der Lebenshaltungskosten beiträgt.
Aber Weizen ist nicht mehr das, was er einmal war.
Als ich 1972 mein Landwirtschaftsstudium abschloss, hatte der Weizen Pilzprobleme und wurde deshalb gentechnisch verändert. Auch was gute Lebensmittel angeht, sind wir jetzt aufgeschmissen. Fazit: Brot ist nicht mehr so, wie unsere Vorfahren es gegessen haben. Sie hatten Glück, dass sie qualitativ hochwertige Lebensmittel hatten.
Deshalb verkaufen Supermärkte diesen Artikel jetzt so billig, da im Grunde Angebot und Nachfrage die Preise landwirtschaftlicher Erzeugnisse beeinflussen. Ich denke, ich diskutiere eher das Prinzip als den Vergleich.
Stabile Regierung
Über Jahrhunderte hinweg wurde der Vergleich von 320 bis 350 Brotlaiben mit einer stabilen Regierung verglichen. Heutige Vergleiche anhand mehrerer von mir verwendeter Formeln ergaben alle 500 bis 680 Brotlaibe pro Spotpreis Gold auf dem heutigen Goldmarkt. Sie können auch andere Formeln ausprobieren, aber ich konnte nicht mathematisch berechnen, dass es mit einem Goldprodukt auf dem heutigen Goldmarkt weniger als 350 Brotlaibe wären.
SCHULDEN
Unsere massive Verschuldung muss ein Faktor sein, der die Stabilität von Regierungen beeinträchtigt. Die weltweite Staatsverschuldung beträgt derzeit rund 71 Billionen Dollar, und zu dieser Zahl kommen noch so viele verschiedene Schuldenebenen hinzu, von privaten bis hin zu kommunalen, öffentlichen und staatlichen Schulden, die sich Ende 2016 weltweit auf gewaltige 223 Billionen Dollar belaufen. Eine weitere statistische Zahl, die ein Albtraum ist, ist, dass in den USA Ende 2017 jeder lebende Mensch 61.365 Dollar Schulden hat. Lassen wir das lieber bleiben, das ist gigantisch und muss, wird, muss implodieren.
GOLDPREISTABELLE
Als ich diesen Artikel schrieb, war der Goldmarkt stabil. Im September 2010 lag der Spotpreis für Gold bei 1247,20 $. Jetzt verstehe ich die Gesetze von Angebot und Nachfrage auf dem Goldmarkt, aber im März 2018 liegt der Goldpreis nur bei 1317 $, obwohl die Nachfrage nach Gold stark ist. Die Goldpreise stagnieren und es gibt viele Gerüchte über Manipulationen.
Aber ich sehe keinen Grund für Gerüchte, denn natürlich manipulieren die Mächtigen heute den Goldmarkt, so wie sie Bitcoin manipulieren werden. Im Jahr 2007 lag der Goldpreis bei nur 688,00 $. Je weiter wir uns von stabilen Regierungen hin zu verschuldeten Regierungen entfernen, desto mehr Widerstand muss es gegen den Goldstandard geben.
BLACK SWAN-VERANSTALTUNGEN
Brauchen wir eine Katastrophe, um den Goldstandard wieder einzuführen und die Verschuldung zu korrigieren? Der Goldstandard könnte endgültig begraben sein. Ein Krieg, wie beispielsweise in Korea, ein massiver Krieg würde die Verschuldung nur noch weiter erhöhen. England hat erst im Dezember 2006 seine massiven Schulden aus dem Zweiten Weltkrieg zurückgezahlt; es hat 61 Jahre gedauert, um 21 Milliarden Pfund zurückzuzahlen.
Die einzige Möglichkeit besteht darin, dass China für eine Überraschung sorgt und den Yuan an den Goldstandard koppelt, da das Land über eine der größten Goldminen der Welt verfügt, über die jedoch keine genauen Informationen verfügbar sind.
Vielleicht wird die Kryptowährung durch Gold gedeckt?
Die Perth Mint in Australien wird im Jahr 2020 eine durch Gold gedeckte Kryptowährung herausbringen.
Fazit 2018
Viele Konjunkturzyklen haben Muster oder Naturgesetze, Siebenjahreszyklen, die 80-20-Regel und erfahrene Finanztaktiker folgen diesen komplizierten ineinandergreifenden Trends und zukünftigen Verträgen. Aber ich habe eine Regel, an die ich mich genau halte -
Besitz ist 9 Zehntel des Gesetzes. Besitzen Sie Ihr eigenes Vermögen. Besitzen Sie Ihr eigenes Haus, besitzen Sie Ihr eigenes Geschäft. Besitzen Sie Ihre eigene große Auswahl an Gold. Kaufen und lagern Sie Ihr physisches Gold und behalten Sie die vollständige und uneingeschränkte Kontrolle über Ihre Goldprodukte.
**ORIGINALER ARTIKEL**
Geschichte des Goldunzenpreises im Vergleich zu einem Laib Brot

Im Alten Testament heißt es, dass im Jahr 600 v. Chr., während der Herrschaft von König Nebukadnezar, ein Laib Brot 350 Laibe Brot pro Unze Gold wert war. Ein Laib Brot war knapp ein Kilo groß, nicht unser verkleinertes Brot von heute.
Bei diesem historischen Rekord handelt es sich um den Vergleich des Brotpreises mit dem Goldpreis, was der Anwendung dieser Methode zur Berechnung des Goldpreises im Vergleich zum Brotlaibpreis einen historischen Vorrang verleiht.
In den letzten 100 Jahren schwankte er zwischen 300 und 388 Laiben pro Unze Gold und war somit ein guter Parameter für historische Aufzeichnungen.
Die Brotkosten sind in Australien von 1990 bis 2008 um 123 % gestiegen. Im Vergleich zu den weltweiten Brotpreissteigerungen ist das weniger als die Hälfte unserer 50-60 %. Aber das hängt mit unserer einzigartigen Position hier in Australien zusammen, da wir Monopolsupermärkte haben, die unsere Nahrungsquelle kontrollieren, und Berechnungen basieren nur auf Brotlaiben im heutigen Australien
- 1997/98 lag der Goldpreis bei 480 Dollar pro Unze und der Brotpreis bei 1,60 Dollar oder 300 Laibe Brot pro Unze.
- 2007/08 lag der Goldpreis bei 800 Dollar pro Unze und der Brotpreis bei 2,50 Dollar oder 320 Laibe Brot pro Unze.
- Im Jahr 2010 kostete Gold 1360 Dollar pro Unze und Brot 3,50 Dollar oder 388 Laibe pro Unze Gold.
Nach Hunderten von Jahren ist das historische Verhältnis erstmals bekannt. Aber das wird das endgültige Verhältnis sein, das ich verwende: 388 zu einer Unze Gold. Das kann bedeuten, dass uns künftige Lebensmittelpreissteigerungen bevorstehen, die unsere historischen 100-Jahres-Rekorde übertreffen.
Ein stabiler Markt von 320-350 Broten wäre der Durchschnitt für eine stabile Regierung und Zeiten des Wohlstands. Unter 320 sind deflationäre Zeiten und über 350 wären Zeiten der Inflation.
Schätzungen mit dem Faktor 388 x 1 entsprechen den Kosten, die dem Verhältnis von Brot zu Gold entsprechen.
- 2010 Gold $1350 entspricht 388 Laiben Brot zu $3,47 pro Laib
- Goldpreis 2015: 2.1425 USD, entspricht 388 Brotlaiben zu je 6,25 USD
- 2020 Gold 5.000 $ entsprechen 388 Broten zu je 12,90 $
- 2020 Gold 10.000 $ entsprechen 388 Broten zu je 25,90 $
Der Goldpreis wurde auf Grundlage der jährlichen Lebensmittelpreissteigerungen berechnet
- 2010 -2015 von 10-15%
- 2015 bis 2020 von 15 bis 50 %
- 2020 bis 2030 von 50 %
Dabei handelt es sich lediglich um Schätzungen, die auf den erwarteten Nahrungsmittelpreissteigerungen infolge des Kohlenwasserstoff-Preisschocks basieren, bis neue saubere Technologien erfunden werden.
Dies sind meine Vorhersagen für September 2010-09-05 Wayne Sedawie
Geschichte der Goldmünzen
Seit der Erfindung des Münzwesens wird Gold zur Herstellung von Münzen verwendet. Goldmünzen galten bereits im 2. Jahrtausend v. Chr. als Lebensader des Mittelmeerhandels. Diese Länder zwischen Euphrat und Tigris sind heute als Ägypten bekannt und diese Münzen hatten grobe Formen und bestanden oft aus Goldklumpen unterschiedlicher Reinheit.
Im 6. Jahrhundert v. Chr. prägte Lydien, heute Westtürkei, die ersten kontrolliert gewogenen Goldmünzen. Das griechische und das römische Reich folgten und prägten Goldmünzen mit dem Kaiserkopf auf einer Seite. Alexander der Große eroberte Persien und brachte über 700.000 Feinunzen Gold nach Griechenland.
- Rom prägte im großen Stil Hunderte Millionen Goldmünzen, die im gesamten Römischen Reich, einschließlich Großbritannien, verbreitet waren.
- Auch in Europa wurden beliebte Goldhandelsmünzen hergestellt
- Der österreichische Golddukat war eine große Münze mit 40 mm Durchmesser.
- Frankreich produzierte die berühmte Goldmünze mit dem Hahn
- Russland prägte Millionen von 5- und 10-Rubel-Goldmünzen
- Großbritannien produzierte Millionen Goldsovereigns und Halfsovereigns
- Die USA prägten die berühmten Goldmünzen mit Indianerkopf und Adler, doch während der Depression von 1933 riefen die USA alle ihre Goldmünzen zurück und erklärten den Besitz von Goldmünzen für illegal.
- Heute ist Australien einer der weltweit größten Goldproduzenten und Goldmünzen werden in der Perth Mint und der Royal Australian Mint geprägt.
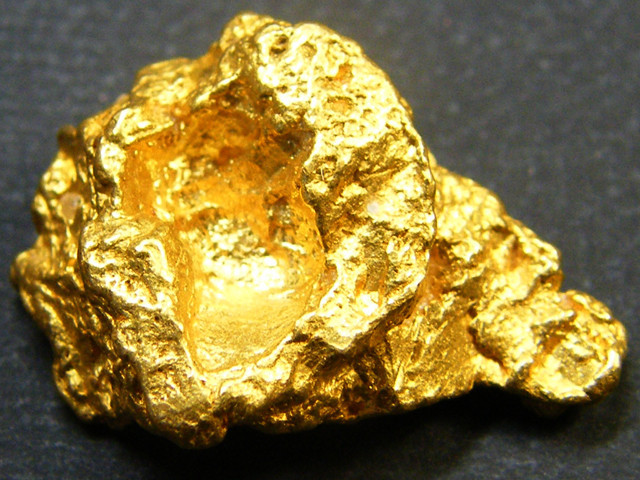
Das australische Nugget

Boxendes Känguru
Mondgoldmünzen, darunter das Jahr des Tigers und die Koala-Goldmünze, das Maskottchen Australiens.
Goldmünzen sind meist eine Unze, eine halbe Unze, 1/10, 1/20, 1/25 und sogar kleinste Größen von 0,5 Gramm.
Heute ist es wichtig, den Feingehalt von Goldmünzen zu verstehen.
Um die Münze haltbarer zu machen, werden dem Gold andere Metalle beigemischt, da reines Gold weich ist und Münzen manchmal stark beansprucht werden und die normale Abnutzung auf ein Minimum beschränkt werden muss.
Das Karatgewicht ist eine anerkannte Einheit für den Feingehalt von Gold und entspricht 1/24 des reinen Goldes.
Reines Gold hat beim Schmelzen einen Feingehalt von 1000.
Zusammenhang zwischen Karat und Feinheit
- 24 Karat = 1000 Feingehalt
- 23 Karat = 958,3 Feingehalt
- 22 Karat = 916,6 Feingehalt
- 21 Karat = 875,0 Feingehalt
- 20 Karat = 833,3 Feingehalt
- 18 Karat = 750,0 Feingehalt
- 16 Karat = 666,7 Feingehalt
- 14 Karat = 583,3 Feingehalt
- 10 Karat = 416,6 Feingehalt
Suche nach Coin Encyclopedia
Verwandte Auktionen


In Verbindung stehende Artikel
Der Penny von 1936 ist eine 1-Cent-Münze aus der „Wheat Penny“-Serie und bedeutsam, da es sich um den ersten Penny in Proof-Qualität seit 1916 handelt. In diesem Handbuch erfahren Sie mehr über die Geschichte, Preise und Varianten der Pennys von 1936!
30th Jan 2024
Der Peace-Dollar ist eine amerikanische Silbermünze, die den Frieden nach dem Ersten Weltkrieg symbolisiert. Er ist zu einer der beliebtesten US-Münzen zum Sammeln geworden. Erfahren Sie mehr über die Geschichte, den Wert und die Bedeutung des Peace-Dollars!
24th Jan 2024
Mercury Dimes oder Winged Liberty Dimes sind 10-Cent-Münzen aus den USA, die von 1916 bis 1945 geprägt wurden und für ihr gelobtes Design und ihren mythologischen Bezug bekannt sind. Erfahren Sie mehr über die Geschichte, das Design und den Wert der Mercury Dimes!
30th Mar 2024
Neue Artikel
Large Cents sind Ein-Cent-Kupfermünzen, die von 1793 bis 1857 geprägt wurden und zu den ersten offiziellen US-Münzen gehörten. Zu den bekanntesten Münzen zählen Kranz- und Kettencents. Erfahren Sie mehr über die Arten, den Wert und die Geschichte der Large Cents!
11th Jul 2025
Hard-Times-Token sind inoffizielle Münzen, die während der Wirtschaftskrise der 1830er Jahre von privaten US-Unternehmen geprägt wurden. Entdecken Sie hier die Geschichte, die rebellischen Designs und den Wert der Hard-Times-Token!
18th Jun 2025
Präsidentendollar sind US-Münzen mit dem Bild aller verstorbenen Präsidenten, die zwischen 2007 und 2020 ausgegeben wurden. Entdecken Sie in diesem Leitfaden Hintergrund, Details und wertvolle Varianten des Präsidentendollars.
5th Jun 2025
Artikelkategorien
Collection of articles providing lots of useful information on coins through the ages.
30 Artikel